Melissa Parsons, Martin Thoms and Richard Norris
Cooperative Research Centre for Freshwater Ecology
University of Canberra
Monitoring River Health Initiative Technical Report Number 22
Environment Australia, 2002
ISSN 1447-1280
ISBN 0 642 54888 9
| VARIABLE NAME | Water odours |
| CATEGORY | Site observations |
| CONTROL OR RESPONSE | Response |
| OFFICE OR FIELD | Field |
| UNITS OF MEASUREMENT | Choice of five categories |
| INDICATES | Chemical or organic pollution in the water |
At each sampling site, note the presence of any odours emanating from the water, as one or more of the following categories:
Variable derived from AusRivAS
There are a large number of chemical variables that can be measured to indicate specific aspects of water quality. The physical assessment protocol provides a method for the assessment of physical stream condition and as such, emphasis has been placed on physical, rather than chemical components. However, several basic water quality variables have been included in the protocol, to correspond with those measured in AusRivAS. The rationale for inclusion of these variables is both biological and physical. For example, dissolved oxygen, pH, temperature and turbidity can effect the structure and composition of biological communities, whereas conductivity and turbidity are indirect indicators of fluvial processes occurring within a river system. Total phosphorus and total nitrogen broadly describe the nutrient status of the stream and may be direct or indirect indicators of human or agricultural impacts on streams. Other water quality variables can be added to the protocol to suit specific State or Territory conditions.
Each of these water quality variables is measured instantaneously on the day of sampling and can be used to flag impacts that may effect biological communities (e.g. low dissolved oxygen), or to flag impacts that may indicate the physical condition of the surrounding catchment (e.g. high turbidity). In addition, these basic water quality variables can be compared against existing long-term water quality monitoring data, or to guideline levels reported in the Australian and New Zealand Guidelines for Fresh and Marine Water Quality. These guidelines can be accessed via the Environment Australia home page at http://www.environment.gov.au/science/water/
While it is important to measure basic water quality variables when at a sampling site, these instantaneous measurements can not be used as response variables in a predictive model, because they are generally highly variable over diurnal, seasonal and long-term time spans. However, where long-term water quality monitoring data (or modelled water quality data) are available for all reference sites, long-term average values can be used as a response variable. Then, instantaneous measurements of water quality at a test site are valid and can be compared against the average long -term values contained in the reference site database.
| VARIABLE NAME | Basic water chemistry and nutrients1 |
| CATEGORY | Site observations |
| CONTROL OR RESPONSE | Response |
| OFFICE OR FIELD | Field |
| UNITS OF MEASUREMENT | Various |
| INDICATES | Status of pH, conductivity, temperature, dissolved oxygen, conductivity, phosphorus and nitrogen at the time of sampling |
1 Other water quality variables can be included if required by each State or Territory.
The basic water chemistry variables measured at each sampling site are:
| Variable | Units | Description |
|---|---|---|
| Temperature | °c | Temperature of the water at the time of sampling. |
| Electrical conductivity | µS cm-1 | Measures the total concentration of inorganic ions (salts) in the water. |
| Dissolved oxygen | mg l-1 | Reflects the equilibrium between oxygen consuming processes (e.g. respiration) and oxygen releasing processes (e.g. photosynthesis). Can also be converted to dissolved oxygen % saturation, which essentially adjusts for altitude and temperature effects on oxygen concentration. |
| Turbidity | NTU or FNU |
Measures the presence of suspended particulate and colloidal matter such as suspended clay, silt, phytoplankton and detritus. |
| pH | - | Measure of the acidity or alkalinity of the water. |
| Total phosphorus | mg l-1 | Indicator of nutrient status |
| Total nitrogen | mg l-1 | Indicator of nutrient status |
All water chemistry variables are taken from one place in the sampling site and should be collected before disturbing the streambed by wading around the site.
Water chemistry variables such as temperature, conductivity, dissolved oxygen, pH and turbidity should be measured in the field using an appropriate measurement apparatus (e.g. Hydrolab or hand held meters). When taking a reading, be sure to stand downstream from the measurement apparatus (Figure 5.17), and make sure that any instruments used in the field are correctly calibrated.
Water chemistry variables such as total phosphorus and total nitrogen require the collection of a water sample (Figure 5.17). Be sure to follow the standard procedures for collection of water samples, to avoid sample contamination or deterioration.
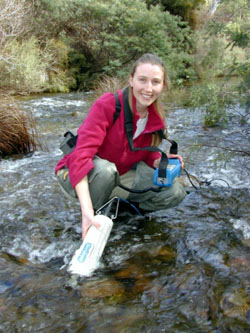
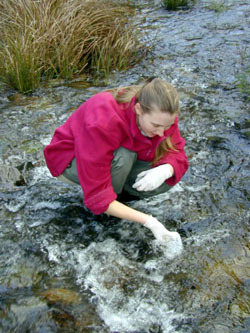
Figure 5.17 Collection of water quality variables using a Hydrolab (left) and collection of a water sample for laboratory analysis (right).
| VARIABLE NAME | Filamentous algae cover |
| CATEGORY | Site observations |
| CONTROL OR RESPONSE | Response |
| OFFICE OR FIELD | Field |
| UNITS OF MEASUREMENT | Choice of five % cover categories |
| INDICATES | Excess filamentous algae growth may be indicative of nutrient enrichment |
At each cross-section, visually estimate the percent cover of filamentous algae growing on organic or inorganic substrates within an area of stream 5m either side of the cross-section. Choose one of the following categories that correspond to the percent cover of filamentous algae within the assessment area:
| Category | Equivalent percent cover |
|---|---|
| very low | <10% |
| low | 10 - 35% |
| moderate | 35 - 65% |
| high | 65 - 90% |
| very high | >90% |
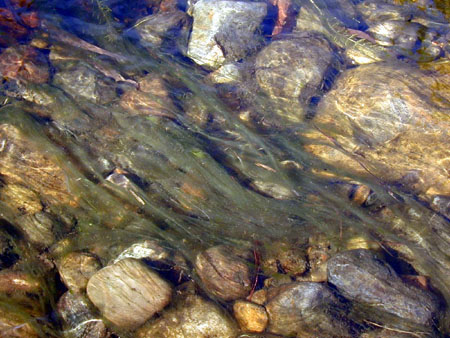
Figure 5.18 Filamentous algae.
Variable derived from AusRivAS
| VARIABLE NAME | Periphyton cover |
| CATEGORY | Site observations |
| CONTROL OR RESPONSE | Response |
| OFFICE OR FIELD | Field |
| UNITS OF MEASUREMENT | Choice of five % cover categories |
| INDICATES | Excess periphyton growth may be indicative of nutrient enrichment |
At each cross-section, visually estimate the percent cover of periphyton growing on organic or inorganic substrates within an area of stream 5m either side of the cross-section. Choose one of the following categories that correspond to the percent cover of periphyton within the assessment area:
| Category | Equivalent percent cover |
|---|---|
| very low | <10% |
| low | 10 - 35% |
| moderate | 35 - 65% |
| high | 65 - 90% |
| very high | >90% |
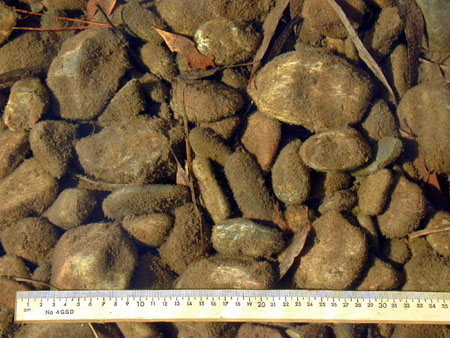
Figure 5.19 Periphyton cover.
Variable derived from AusRivAS
| VARIABLE NAME | Moss cover |
| CATEGORY | Site observations |
| CONTROL OR RESPONSE | Response |
| OFFICE OR FIELD | Field |
| UNITS OF MEASUREMENT | Choice of five % cover categories |
| INDICATES | In upland sites, presence of moss may indicate the time since the last high flow event that moved bed sediments |
At each cross-section, visually estimate the percent cover of moss growing on substrates within an area of stream 5m either side of the cross-section. Choose one of the following categories that correspond to the percent cover of moss within the assessment area:
| Category | Equivalent percent cover |
|---|---|
| very low | <10% |
| low | 10 - 35% |
| moderate | 35 - 65% |
| high | 65 - 90% |
| very high | >90% |
Variable derived from AusRivAS
| VARIABLE NAME | Detritus cover |
| CATEGORY | Site observations |
| CONTROL OR RESPONSE | Response |
| OFFICE OR FIELD | Field |
| UNITS OF MEASUREMENT | Choice of five % cover categories |
| INDICATES | Detritus is an important food resource for macroinvertebrates. |
At each cross section, visually estimate the percent cover detritus (sticks less than 10cm diameter and 1m long (ie. not large woody debris), twigs and terrestrially derived vegetation within an area 5m either side of the cross-section. Choose one of the following categories that correspond to the percent cover of detritus within the assessment area:
| Category | Equivalent percent cover |
|---|---|
| very low | <10% |
| low | 10 - 35% |
| moderate | 35 - 65% |
| high | 65 - 90% |
| very high | >90% |
Variable derived from AusRivAS