
5.5 Predicted/collected |

|

|

|

|
||
|
5.5 Predicted/collected |
|
|
|

|

|
5.5 Predicted/collected
|
5.5 Predicted/collected |
|
|
|
|
||
|
5.5 Predicted/collected |
|
|
|
|
|
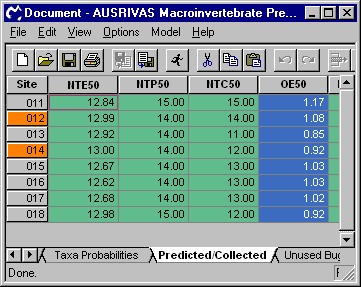
The predicted/collected data sheet provides an assessment of biological condition of a test site. The indices produced here are described in the following sections.
5.5.1 Predicted, expected and observed taxa
The first four columns of the predicted/collected data sheet give information on the predicted, expected and observed numbers of taxa.
NTE50
The Number of inverTebrate families Expected with greater than a 50% probability of occurrence, NTE50, is the sum of the probabilities of all the families predicted with greater than a 50% chance of occurrence
NTP50
NTP50 is a count of the Number of inverTebrate families Predicted with greater than a 50% probability of occurrence
NTC50
The inverTebrate families that were predicted above the threshold probability of 50% and which were also Collected at the test site are counted to form the observed (collected) value, NTC50.
OE50
The Observed to Expected ratio, OE50, is the ratio of the number of invertebrate families observed at a site (NTC50) to the number of families expected (NTE50) at that site. OE50 provides a measure of biological impairment at the test site.
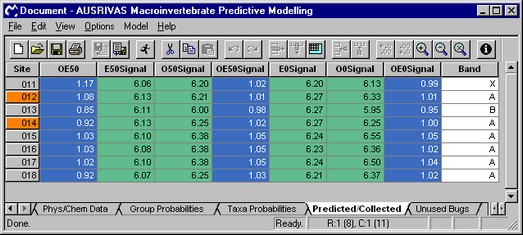
The output of these four indices is shown in the screen shot below.
5.5.2 Predicted, expected and observed signal
In addition to calculating the expected number of taxa at a test site, AUSRIVAS also calculates the SIGNAL scores for a site. Calculation of the SIGNAL scores uses SIGNAL grades, an assigned value given to each invertebrate family that indicates their sensitivity to pollution. Columns 5 to 10 in the Predicted/Collected data sheet contain the calculated signal scores, each of which is explained below.
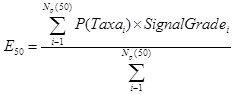
E50Signal
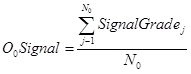
E50Signal is the expected signal score for taxa that have a probability of occurrence of greater than or equal to 50%. It is calculated by weighting the probability of occurrence of each predicted taxa (those taxa that have a probability of occurrence of greater than or equal to 50%) by the taxon's SIGNAL Grade, summing these and then dividing the total by the sum of the (unweighted) probabilities of occurrence.
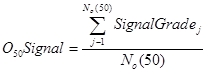
O50Signal
O50Signal is the observed signal score for taxa that have a probability of occurrence of greater than or equal to 50%. It is calculated by averaging the SIGNAL Grade's for all observed taxa with P(Taxa) >= 0.5.
OE50Signal
The observed to expected SIGNAL ratio, OE50Signal, is the ratio of E50Signal to O50Signal.
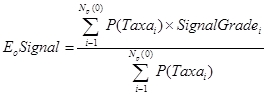
E0Signal
E0Signal is calculated the same way as E50Signal, except all taxa that have a probability of occurrence of greater than 0% are included in the calculation.
O0Signal
O0Signal is the observed signal score for taxa that have a probability of occurrence (P(Taxa)) of greater than 0%. It is calculated by averaging the SIGNAL Grade's for all observed taxa. O0Signal is equivalent to the ‘raw’ SIGNAL score (Chessman, 1995).
OE0Signal
The observed to expected SIGNAL ratio, OE0Signal, is the ratio of E0Signal to O0Signal.
The calculated SIGNAL Scores are shown in the screen shot below.
5.5.3 The banding scheme
For each model the O/E taxa ratios are divided into bands representing different levels of impairment. Band X represents a richer invertebrate community than reference, band A is considered equivalent to reference; band B represents sites below reference condition; band C represents sites well below reference condition; and band D represents impoverished sites. The band for each site is listed in the last column on the Predicted/Collected data sheet, as shown in the screen shot above.
5.5.4 Further information
For further explanation of how indices and bands are calculated, refer to the AUSRIVAS Predictive Modelling Manual, particularly Chapter 3, 'The AUSRIVAS Models'.
