5.4 Taxa probabilities |

|

|

|

|
||
|
5.4 Taxa probabilities |
|
|
|

|

|
5.4 Taxa probabilities
|
5.4 Taxa probabilities |
|
|
|
|
||
|
5.4 Taxa probabilities |
|
|
|
|
|
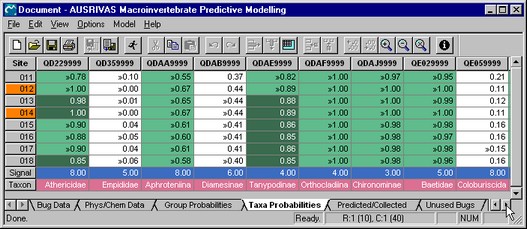
The ![]() sheet lists the probability of each taxon being found at a tested site.
sheet lists the probability of each taxon being found at a tested site.
Taxa that were present (collected) at the test site are flagged (») and those with >0.50 probability of occurrence are highlighted in light green. Taxa that were predicted with > 0.50 probability of occurrence but not collected are highlighted dark green. Other taxa that were not collected at a site are shown in white on the AUSRIVAS screen.
This output can be used to determine what taxa you would expect to find at the test site and whether they were actually collected. A taxon with a 0.12 probability of occurrence that was not collected would not be cause for concern because it would rarely be found, even if the site were equivalent to reference. However, if a taxon with a 0.95 probability of occurrence was not collected it is reasonable to assume that some impact may have caused its absence.
The SIGNAL grades for these families are also provided at the end of the spreadsheet to give a general indication of the sensitivity of each of the families to pollution. Biological information about that taxon may then indicate the type of impact the test site could be experiencing, providing a focus for further investigation. The signal grades are highlighted in blue.
Taxon names are also provided on this data sheet. They are highlighted in pink.